Go to homepage

8 November 2024 Updates

  1. Fixed an issue that caused some disabled integrations to not be visible in the settings view.

  2. A new dotted horizontal line will appear for line charts in reports highlighting the Y Axis at 0 helping you distinguish between positive and negative values.

New Features Launched

  1. Dates are now available as dimensions - See post here


Dates as a dimension

Dates as a dimension

We have added the possibility of setting dates as dimensions in the table. This allows you to visualize all the data in the tables with time granularity for better analysis.


Top and Bottom % Filters

Top and Bottom % Filters

We added 2 new filters for metrics in the reports page, "Is top %" and "Is bottom %", allowing you to filter metric columns and see the top or bottom performing rows


25 October 2024 Updates

  1. It is now possible to see marketing spend per channel at a product level.

  2. We have added the following dimensions to the taxonomy part in manual settings: Product name, Product ID, and Variant ID.

  3. Moved the user profile page into the settings page under a new section called Account.

  4. Added all ad-related metrics to the first two widgets in marketing dashboard.

  5. We added support for users with multiple merchants to be able to change merchants easily; this is beneficial for agency users who have access to multiple Dema merchants.

New Features Launched

  1. Changed the sort order of the chart in the reports page - See post here

  2. Top and Bottom % filters - See post here


Chart Sorting Flexibility

Chart Sorting Flexibility

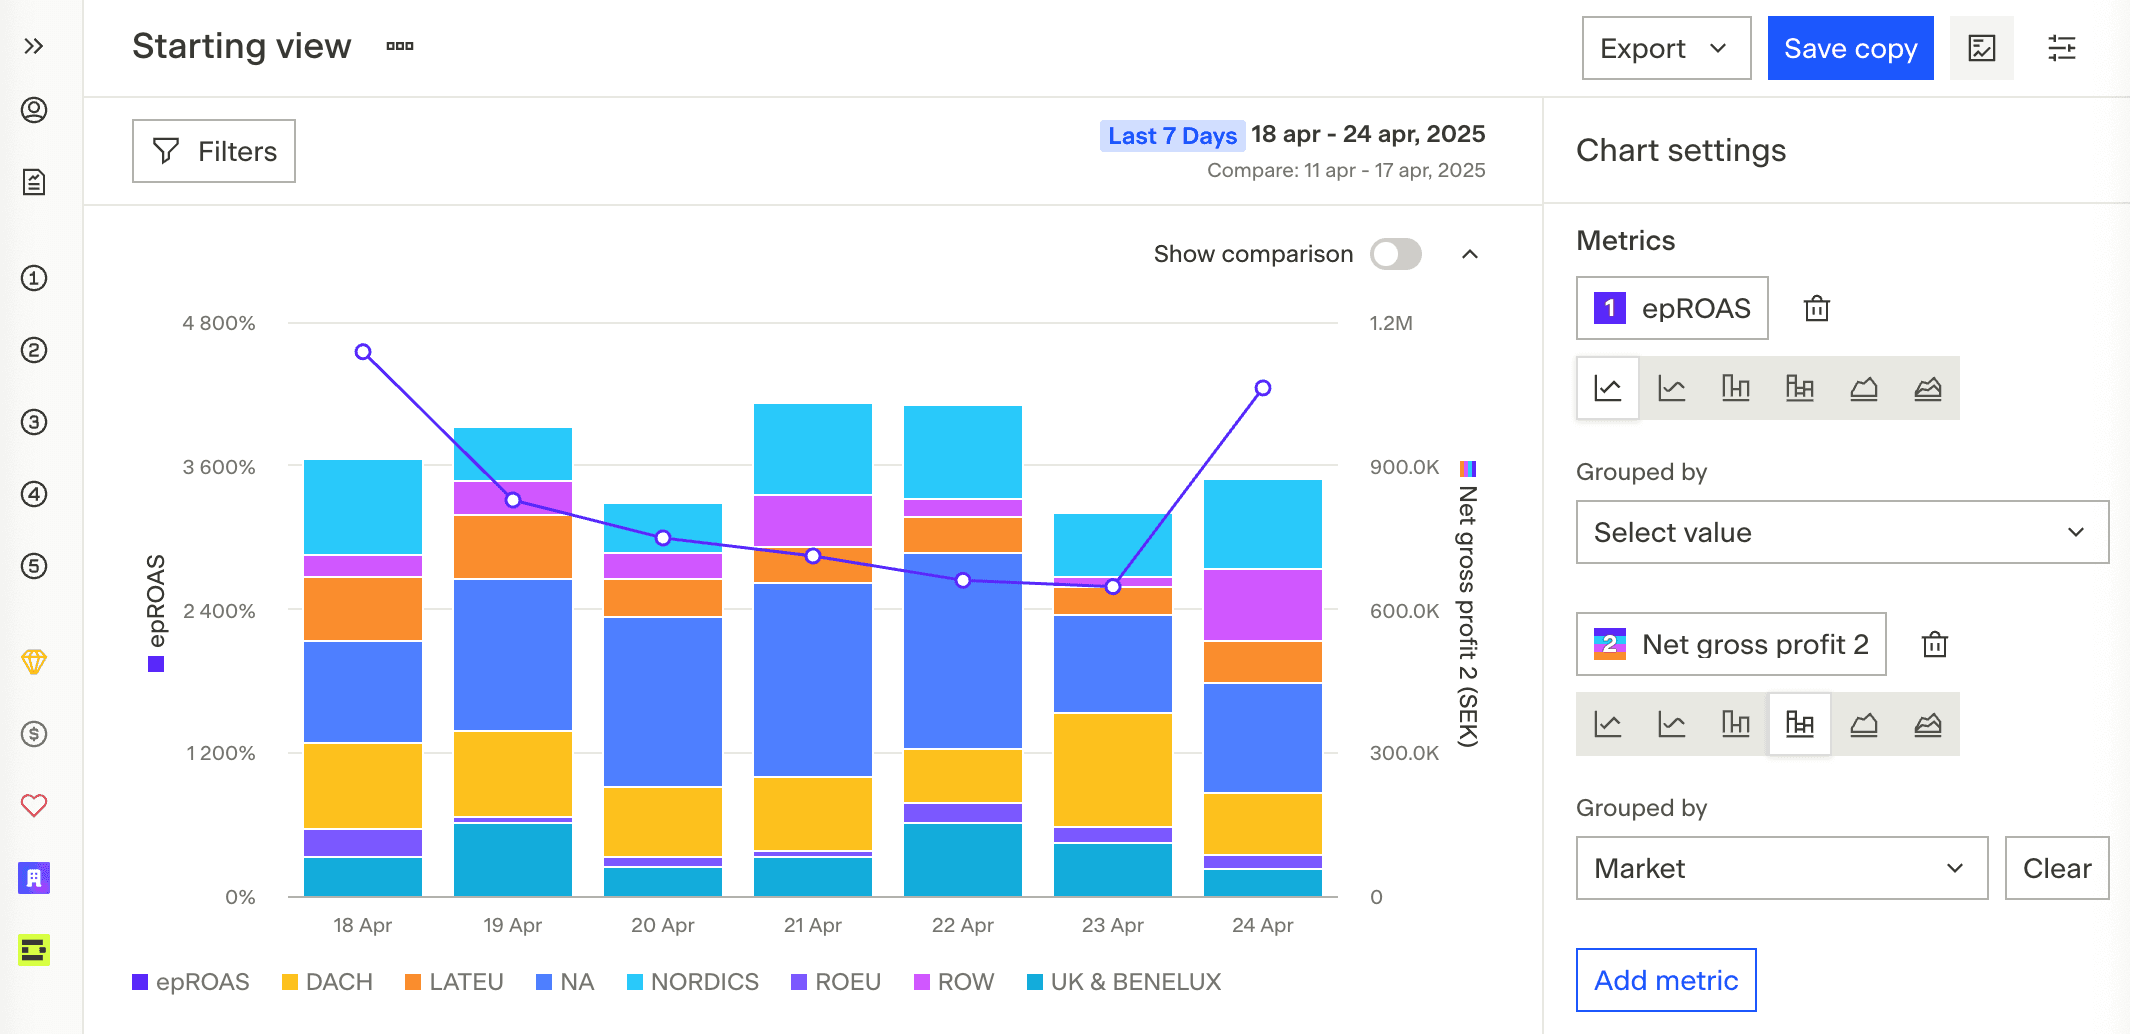
We launched a new feature that allows you to change how chart columns in the report view are sorted. You can sort by the x-axis or any metric from a selected series, in ascending or descending order.

The new sorting options can be found in the right panel for chart settings under x-axis.

Note that this feature isn't available for time-based x-axes or scatter/pie charts.


11 October 2024 Updates

  1. Resolved an issue that would cause the report name to sometimes not be updated correctly after saving a report.

  2. Removed access to Organisation and Dema reports tab for guest users.

  3. Fixed an issue were newly added metrics where not saved correctly sometimes in the report.

  4. We also launched an update to the app that will notify you when there is a new version helping you stay up to date with new updates

Some new features launched

  1. The ability to sort on comparison values in the table - See post here

  2. Change between percentage and absolute difference for the compare value - See post here


Sort on Comparison & Toggle Between % and Absolute Values

Sort on Comparison & Toggle Between % and Absolute Values

We’ve just introduced two powerful new features to help you analyze your data more effectively:

  1. You can now sort table columns based on the comparison value.

  2. There is a new button in the right panel that allows you to swap between percentage difference and absolute difference.

When combined, these features offer a more comprehensive view, enabling deeper exploration of your data. We hope this enhancement brings even more value to your Dema experience!


Improved

Fixed

27 September 2024 Updates

  1. We added the following metrics, Toll, Pick and pack, Transaction and Shipping cost.

  2. Removed attribution from metric label on filters when only one attribution is selected.

  3. On the reports list view, sometimes certain reports did not show the labels for the report. This has now been fixed.

  4. We also release a big overhaul on how the reports page works internally. This change should make the reports page faster and more responsive to work with. Also, you might noticed that the url will look different moving forward and be shorter, but this will not have any noticeable effect and sharing reports should works just as fine as before.


Improved

Filter on same Dimensions/Metric

Filter on same Dimensions/Metric

Finding the data that you need, when you need it, is at the core of Dema. Last week we took a step further by allowing you to add multiple filters on the same Dimension or Metric.

This opens up the door to dig deeper into your data.

Filters will be getting some more love looking ahead, so keep an eye out for more updates to come!


Improved

Chart Colors: A Fresh Coat of Paint

Chart Colors: A Fresh Coat of Paint

We love data, and we want you to love looking at it too. The new colors aren't just a visual refresh, they're designed to make your charts clearer and more intuitive at a glance. This week we launched new colors for the charts to give it a new feel!

All chart functionality remains the same. This was only a visual update.

We're excited about this update and hope it makes your Dema experience even better. As always, we're keen to hear your thoughts!


Real-Time Webhook Integration for Shopify, Commercetools, and Centra

We are excited to announce that we are now live with real-time webhook data for Shopify, Commercetools, and Centra. This means we can fetch order data directly from these platforms as soon as the order is placed, without having to rely solely on tracking data. While tracking is still used for all other site events, this direct integration provides several key benefits:

  1. Enhanced Data Accuracy: Orders received through tracking will be enriched with data directly from the ecommerce platforms, allowing us to connect the order to the session in tracking. This ensures accurate attribution and minimizes the risk of missing orders due to tracking issues, such as misconfigured scripts.

  2. Comprehensive Order Information: The webhook data includes detailed information such as original prices, discounts, and shipping providers, which may not always be captured through traditional tracking methods. This additional data helps us provide more granular insights and accurate profitability calculations.

  3. Improved Daily Sales Reporting: Historically, orders missed in tracking due to factors like ad blockers were backfilled the next day, which sometimes caused daily sales figures to appear lower than they actually were. With real-time webhooks, we now capture all orders as they occur, providing a more accurate and up-to-date view of daily sales performance.

This integration significantly improves data reliability and depth, making it easier for you to monitor and optimize your ecommerce performance in real-time. If you haven’t already activated, please reach out to our customer success team to get started.


Marketing Mix Modeling

Marketing Mix Modeling

We are excited to announce that our Marketing Mix Modeling (MMM) tool is now officially part of our platform offering! This comprehensive feature empowers you to optimize your marketing strategy through three key sections:

  1. Analyze Historical Performance: Dive deep into your marketing data with our week-by-week performance analysis. Leverage detailed saturation curves to pinpoint where you may have overspent or underspent, and gain a clearer understanding of how to allocate your marketing budget more effectively.

  2. Historical Insights for Missed Opportunities: Understand the effectiveness of your marketing efforts over time. Our historical view provides an in-depth analysis of missed opportunities, allowing you to identify periods of underperformance and adjust your strategy accordingly.

  3. Future Scenario Creator: Plan ahead with confidence using our future scenario creator. This tool enables you to simulate different budget allocations across upcoming weeks, helping you to find the optimal distribution of your marketing spend for maximum ROI.

Our MMM tool is designed to provide actionable insights that go beyond basic attribution models, allowing you to make data-driven decisions and unlock the full potential of your marketing investments. If you’re interested in accessing this feature, please contact our team to learn more about how you can add it to your plan.


Targets

You can now set specific targets across various dimensions, such as product categories, brands, channels, warehouses, and countries. These targets can be applied to a wide range of metrics, including profitability, orders, and products sold. Once implemented, you’ll be able to track how your performance trends against these targets directly within the platform, helping you stay aligned with your goals in real-time. Please reach out to our customer success team to get your targets set up.


Improved

Fixed

16 September 2024 Updates

  1. Settings Page Visibility Fix: Resolved an issue where some manually entered dimension values were not displaying in input fields on the settings page.


Improved

Fixed

5 September 2024 Updates

  1. Report Owner Sorting: We resolved an issue that was causing the sorting on report owners in the reports view to not function as expected.

  2. New Cost Settings Dimension: We've added the "Material" dimension to the costs section of the settings.

  3. Dropdown Layout Fix: We fixed an issue that was preventing the role dropdown for user invites from being visible.

  4. Improved Chart Sorting: We changed the sorting functionality for chart axis labels to prioritise the associated data values over alphabetical order.

  5. Saved Report Column Order Persistence: We addressed an issue where changes made to the column order in reports were not being properly saved when later visiting the report.


Improved

Fixed

5 August 2024 Updates

  1. Group selection in drop-downs: We've enhanced certain drop-downs to allow selection of entire groups at once.

  2. Custom attributes on taxonomy level: You can now add taxonomy configurations for dimensions specific to your merchant.

  3. Label filters for reports: We've introduced the ability to filter your report views based on labels.


Roadmap Update: New Projects Added

We have updated our roadmap with exciting new projects. You can view them under "Planned Projects" at https://inside.dema.ai/roadmap.

We have incorporated many of the features that received the most upvotes from you. We genuinely appreciate your feedback, both on the platform and during meetings.

There are primarily three different areas where we are putting in a lot of effort in the upcoming months:

  • Improving the report selector: Enhancing the ease of filtering, sorting, selecting graphs, and picking all the dimensions you need.

  • Adding additional marketing integrations.

  • Improving order data: Building on previous quarter's efforts to include actual returns, understanding order statuses, discounts, shipping costs, FX rates, taxes, and real-time updates for all orders, even if they are not tracked.

In addition, we have a strong focus on improving our customers' understanding of their marketing performance. This includes further enhancements to the Marketing Mix Modeling (MMM) and marketing cost on products.

Note on Prioritization: Some previously planned projects have been deprioritized for now as they do not align well with our current timeline. These projects will be revisited in the future. The affected projects are:

  • Product pictures in the platform

  • Cookieless tracking using IP, user agent, and salt hash

  • Combining Shopify integrations into a 1-click setup


Improved

Fixed

22 July 2024 Updates

  1. Compare Date Removal: We've fixed a bug that prevented users from removing the compare date in reports.

  2. Clickable Dropdown Checkboxes: Addressed a problem where certain dropdown options were not responding to clicks.

  3. Guest User View Fix: Corrected an issue causing guest users to see invalid owners in the reports table.


Improved

Fixed

8 July 2024 Updates

  1. Filter Input Value Persistence: Fixed an issue where the search field for filters on the reports page sometimes persisted when changing the filter type.

  2. Chart Tooltip Improvements: Fixed an issue where the tooltip for charts, when grouped by a dimension, displayed too many "N/A" values, making it hard to read. This improvement enhances clarity and ease of use.

  3. Date Picker "X" Button Overflow: Fixed an issue where the "X" button in the date picker for reports overflowed, ensuring it stays within the date picker for better usability.

  4. Members Visibility Issue: Fixed an issue that caused some users to not be visible on the members page.

  5. Reports and Teams Overhaul: We launched our biggest reports overhaul to date, introducing a more efficient way to manage reports and teams, along with numerous other improvements. Read more here.


New

Enhanced Report Views: Teams, Favorites, and More

Enhanced Report Views: Teams, Favorites, and More

We are thrilled to introduce the new and improved report views, packed with powerful features like teams, favourites, and visibility. These enhancements will elevate your report exploration and creation to new heights.

Here are some highlights:

Teams

Create teams to manage your organisation efficiently. By focusing on relevant metrics and dimensions, you'll streamline workflows and produce high-quality reports for any department - Marketing, Product, Sales, or any area you choose.

Roles

Assign permissions tailored to your needs by giving users one of the following roles:

  • Admin: Full control over the organisation.

  • Member: Access to most features, with some restrictions (e.g. editing fulfilment costs).

  • Guest: Limited access to specific teams, reports, and datasets.

Visibility

Organise your reports by setting their visibility. Choose Private for personal exploration or share them with specific teams or the entire organisation.

Labels

Easily tag your reports with custom labels that you can create and edit, making it simpler and more intuitive to organise and find your way around reports.

Quick Access to Reports

Navigate effortlessly using the left sidebar:

  • My Reports: View all reports that you are the owner of.

  • All Reports: A comprehensive list of all your accessible reports.

  • Favourites: Quickly access reports you’ve marked as favourites.

  • Teams: See reports by team and join new teams with the "Join Team" button.

The left sidebar can be minimised to save space, while still providing easy access to the different views and reports listed above.

Report details and chart settings

Report details such as dimensions, metrics and the new visibility and labels features described above have been moved to a new sidebar to the right. This sidebar can be toggled between displaying report details, chart settings or being hidden.

Enhanced Organisational Control

Manage your organisation with added functionality for editing name and logo, managing members, labels, and team settings.

Our motivation is to make reports an essential and enjoyable part of your platform experience.

We hope you find these enhancements beneficial. Happy reporting!


Improved

Fixed

23 June 2024 Updates

  1. Members Visibility Issue: Fixed an issue where some members in your organisation were not visible in the members table on the settings page.

  2. New Metrics in Overview Dashboard: Added the following metrics to the markets widget: Net Sales, Visits, Average Order Value, and Conversion Rate.

  3. Warehouse Taxonomy Level: Added Warehouse as a taxonomy level in the manual inputs settings page for better data organisation.

  4. New Currencies in Manual Inputs: Added NOK, CAD, CHF, AUD, CNY, and JPY as available currencies for all manual inputs.


Fixed

10 June 2024 Updates

  1. Chart Display Improvement: We've fixed a bug in the line chart where it always started at 0 on the y-axis, making it difficult to see real changes.

  2. Date Picker Visibility: We've resolved an issue that caused the date picker on the reports page to be partially hidden.

  3. Expanded Date Range for Reports: We've added "Last 12 Months" as a new date range option on the reports page.

  4. Report Filter Issue Resolved: We've fixed a bug that caused the search input in the report filter to be removed when clicking just left of the 'Select All' option.


Fixed

28 May 2024 Updates

  1. Dynamic date range selection - Added a new "Last 12 Months" option for date range selection, making it easier to view data for the past year.

  2. Future dates in manual marketing costs - You can now set marketing costs for future dates on the settings page, enabling better budget planning.

  3. Scatter chart colors - Fixed a bug that caused scatter points to appear in the same color when there were many points, improving chart readability.


Fixed

10 May 2024 Updates

  1. Profile pictures available: We added a new section in your profile page that allows you to swap out your profile picture. The profile pictures are currently only visible in the team page but will be seen more in upcoming releases!

  2. New dimensions in manual inputs: We've added support for shipping providers in the "shipping costs" tab and payment providers in the "transactions costs" tab.

  3. Reports filter fix: We resolved a bug that prevented some metric filters from being removed on the report page when the corresponding metric was deleted.

  4. Silenced errors: We fixed an issue that caused the app to show error alerts on certain pages without any user-triggered actions.


New vs Returning Customer Dimensions

We are pleased to announce that the most requested feature - "New vs Returning Customer" dimension is live.

The dimensions can be found in the platform, under "Order" dimensions and we have added two different alternatives:

  • New vs Returning Customer

    • Categorizes customers as either "new" or "returning". A customer is classified as "new" if it is the first order associated with that specific customer ID. Otherwise, they are classified as "returning".

  • New vs Returning Customer (30 days):

    • Categorizes customers as either "new" or "returning". A customer is classified as "new" if it is an order placed within 30 days of their first-ever order with that specific customer ID. Otherwise, they are classified as "returning". This is to easier prevent customers that place a second order due to a return gets classified as a new customer.

You can also use these dimensions as filters, e.g. filter out all sales coming from new customers.


Improved

Improved Date Picker

Improved Date Picker

We're excited to share improvements to our Date Picker based on customer feedback! Here's a quick overview of what's changed:

  • End Date Reset: You can now reset just the end date of a date range by clicking on it, without effecting the start date.

  • Removed Comparison Range Reset: If you select a new main range (e.g. last 7 days from last 28 days), you will still leave the comparison range intact (e.g. Same dates preceding year).

    • Special case: When a custom range is selected as compare, the comparison range is kept with the same number of days but moved to a new position (same distance from the main range as before)

  • Month and Year Navigation: Seamlessly navigate through months and years using the new dropdowns in the date picker.

  • Automatic Navigation: Selecting a new main date range will automatically adjust the date picker to highlight your new selection.

  • Updated Styling: Enjoy a fresh, modernized look for the date picker.


Improved

Existing Channel Mappings

Existing Channel Mappings

We are excited to share that you can now easily can update already existing channel mappings!

Navigate to Settings -> Mapping -> Existing Mappings to view all your current mappings.

Viewing Existing Mappings

Easily review all your channel mappings associated with UTM parameters to see how traffic is being directed and categorized in your analytics.

Deleting Mappings

You now have the ability to delete any existing mappings. Deleting a mapping will ensure that all future traffic using those specific UTM parameters will not be associated with the deleted channel or channel group. Please note, this change will not affect historical tracking data.


New

Google Sign In Now Available

Google Sign In Now Available

We're thrilled to announce that Google Sign-In is now available!

If your Dema account email matches your Google account email, you can log in effortlessly using Google Sign-In. For instance, if your email is "info@dema.ai" for both Dema and Google, you're all set to use this convenient feature. Please note, Google Sign-In is only available if your email addresses match across both accounts.

However, it's important to mention that currently, new accounts cannot be created via a team invite using Google. You'll need to set up your Dema account using the traditional email and password method. But once your account is up and running, you can enjoy the simplicity of signing in through Google without any additional setup.


Fixed

29 April 2024 Updates

  1. Marketing dashboard responsiveness improvements: Building up upon last weeks fixes, we improved the responsiveness for mobile devices and also fixed layout shifts from the skeleton widgets.

  2. Brand new icons: We recently launched an update changing our graphic profile of the app, and now we also updated all of the icons through out the app to align more with our new brand. Hope you like it just as much as we do!

  3. Dashboard tooltips not showing compare %: Fixed a bug that made the tooltip in some of the widgets in the dashboard not show the comparison percentage difference for the last date in the range.

  4. Reports table header width: Fixed a bug that made some of the header cells in the table take up more space then the rest of the column.

  5. Compare values in exported data not showing: We fixed an issue that made exported table data not include the compare values.

  6. Tooltip for metric cards in dashboard: We added a brand new tooltip for the metric cards that display the compare value for the metric.


New

New Colours and Branding in Our Platform

New Colours and Branding in Our Platform

We are excited to unveil a fresh, new redesign of the platform, aligned with our new branding - meaning new identity, feel and colours! We've also introduced a new signature color, Dema Blue, as the primary color throughout our platform. This eye-catching blue is designed to highlight key features and improve usability.

Why This Change?

The redesign aims to better align with our new brand and elevate the overall user experience. We’ve focused on engaging design elements to create a more productive and enjoyable environment for our users.


Fixed

13 April 2024 Updates

  1. Historical Mappings Added: You can now view historical mappings in the settings page

  2. Dashboard Responsiveness Enhancements: We've improved the responsiveness of our dashboards, ensuring smoother interactions across different devices.

  3. Full-Width Table Columns: By default, table columns now expand to take full advantage of the available table width.

  4. Tooltips for Dimensions and Metrics: Hovering over dimensions and metrics in table headers now displays tooltips showing the description.

  5. Automatic Removal of Invalid Filters: When you change dimensions, any non-applicable filters are now automatically removed.

  6. Dashboard Donut Chart Tooltips: Fixed an issue that incorrectly showed invalid compare time in the tooltip

  7. Easy data exporting: We made it clearer and easier to export data in te reports page with a button in the left sidebar.

  8. General Bug Fixes and Improvements: Various other minor bugs have been fixed, and improvements have been made across the platform to enhance overall user experience.


New

Enhanced Manual Inputs

Enhanced Manual Inputs

The "Enhanced Manual Inputs" feature introduces a significant upgrade to how costs associated with logistics are managed within our system. This enhancement allows for a more detailed and granular approach to inputting logistic costs for both incoming and return orders. Previously, our platform only had one cost called "logistics" related to Gross Profit 2. The latest update expands this by enabling users to specify various cost components such as shipping, pick and pack, customs, and transaction fees.

Key Features and Benefits:

  • Granular Cost Inputs: Users can now input costs in a more detailed manner, breaking down the logistics into specific categories.

    • Pick and pack

    • Shipping

    • Customs

    • Transactions

  • Flexible Hierarchy Settings: Costs can be set based on multiple hierarchies, such as Country and Category.

  • Cost Allocation Methods: The system supports different methods of allocating costs, including Fixed per order, Fixed per product, and a percentage of the order value.

  • Applicability to New Orders: The enhanced manual inputs are applied to new orders.

Transition and Compatibility:

  • Compatibility with Previous Settings: Existing cost settings, specifically those previously categorized under "logistics," will now be allocated to shipping. This ensures a seamless transition to the new system while maintaining the integrity of historical data.

  • Action Required for Updating Old Orders: Users interested in applying the new cost framework to historical orders are encouraged to reach out to the dema team for assistance.


Fixed

29 March 2024 Updates

  1. Enhanced Table Descriptions in Reports: Now, when you hover over dimensions and metrics within report tables, a description will appear, providing clearer insights into the data you're analyzing.

  2. Bug Fix: Filtered Metrics: We've addressed and fixed an issue where filtered metrics were not being removed as expected.

  3. Improved Default Metric Ordering: The default order of metrics in tables has been adjusted for better readability and to be aligned with the dropdown order of metrics.

  4. Donut Chart Tooltip Adjustment: We've removed the compare value from the tooltip in donut charts on the marketing dashboard.


New

Member Invitations and Role Management

Member Invitations and Role Management

We're excited to announce a new update that enhances how you can manage your team on our platform.

Easier Member Invitations: You can now invite members to your team through the user menu located in the upper right-hand corner of the platform. Simply send an invite by entering their email address, and they'll receive an invitation to join with instructions for setting their own password.

Defined Roles for Better Control: To help you manage your team's access and responsibilities more effectively, we've introduced two distinct roles:

  • Admin: Has the authority to update all settings, including manual inputs and integrations.

  • Member: Can view all settings but does not have the permission to make changes.

Password Reset Made Simple: If you ever forget your password, you can easily reset it directly from the login page or your profile page, ensuring continuous access to the platform.


New

System Status Page

System Status Page

To provide you with real-time insights into our platform's performance, we've launched a system status page at status.dema.ai. Here, you can monitor the current status of our systems, including tracking, tag management, API, and the web application itself. Additionally, the page offers a log of historical issues for complete transparency.