AI-powered analytics for realtime insights
Uncover decisive insights about your business faster than ever
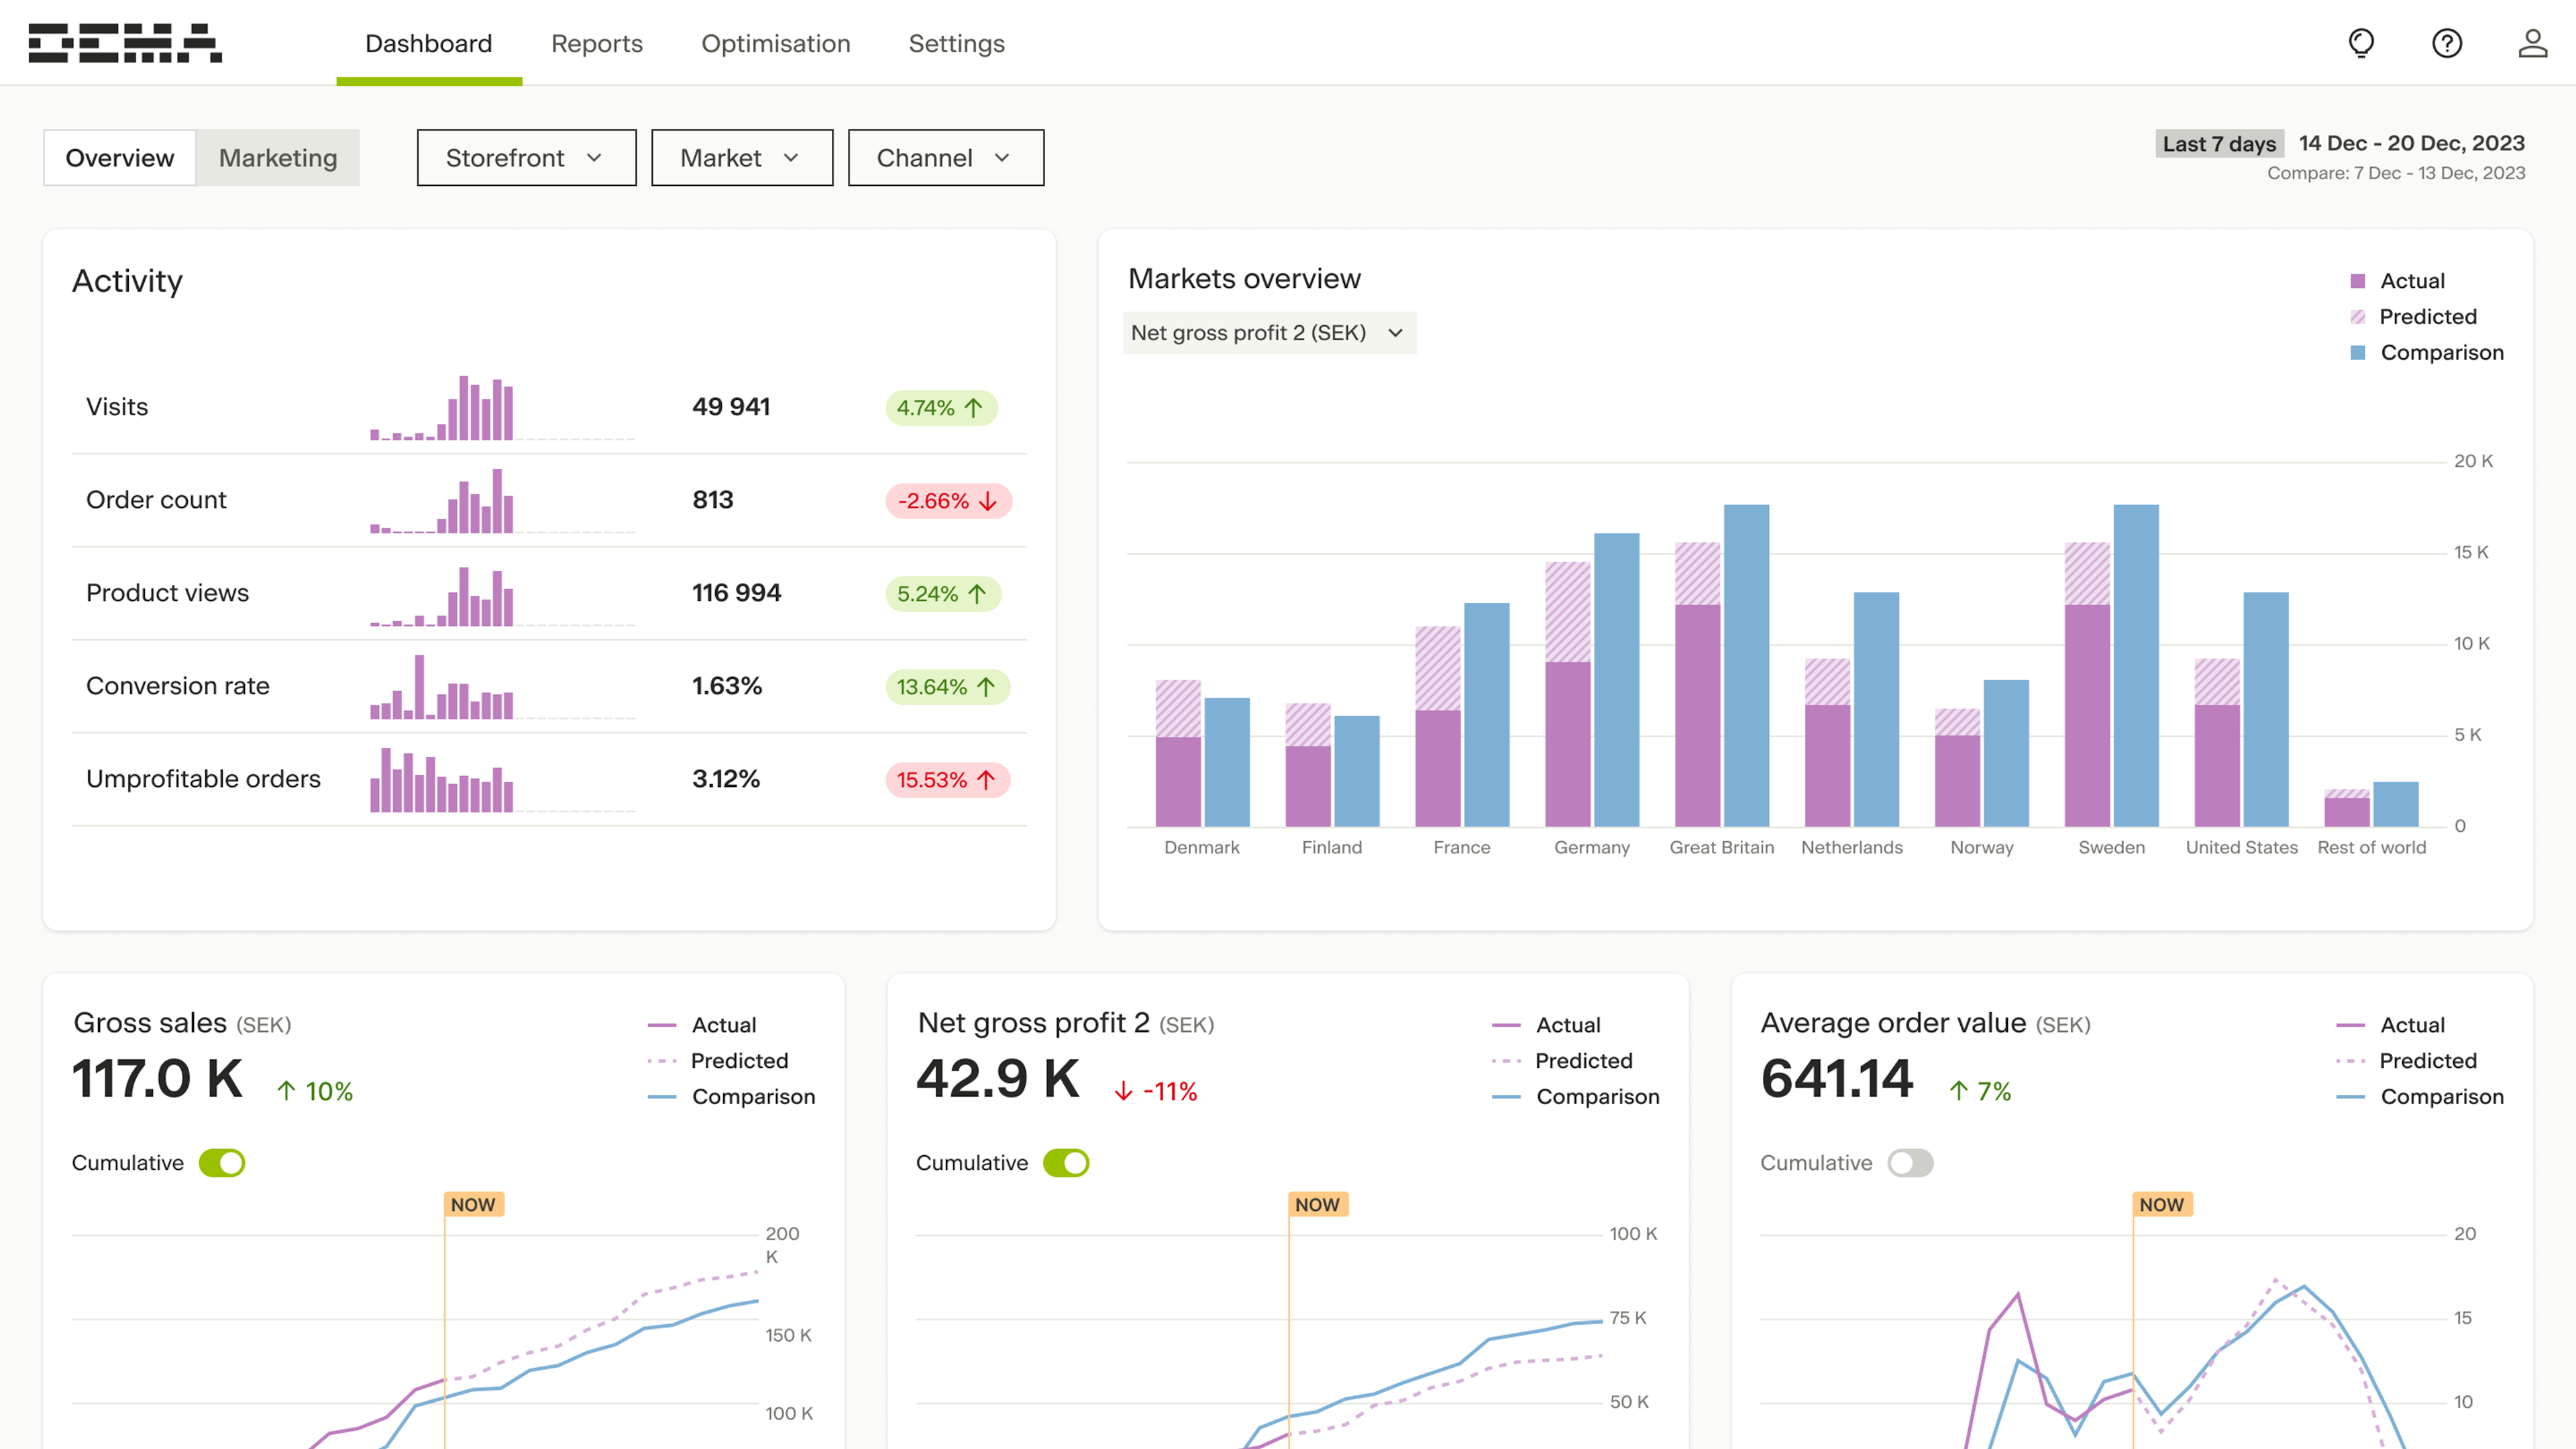
Unify all your data sources in one place
Imagine one click to get to a real-time analysis with insights based on all your marketing, cost, and product data.
- Track all session data in real-time
- Clean, enrich, and present all your data
- 50+ ready-to-use actionable reports
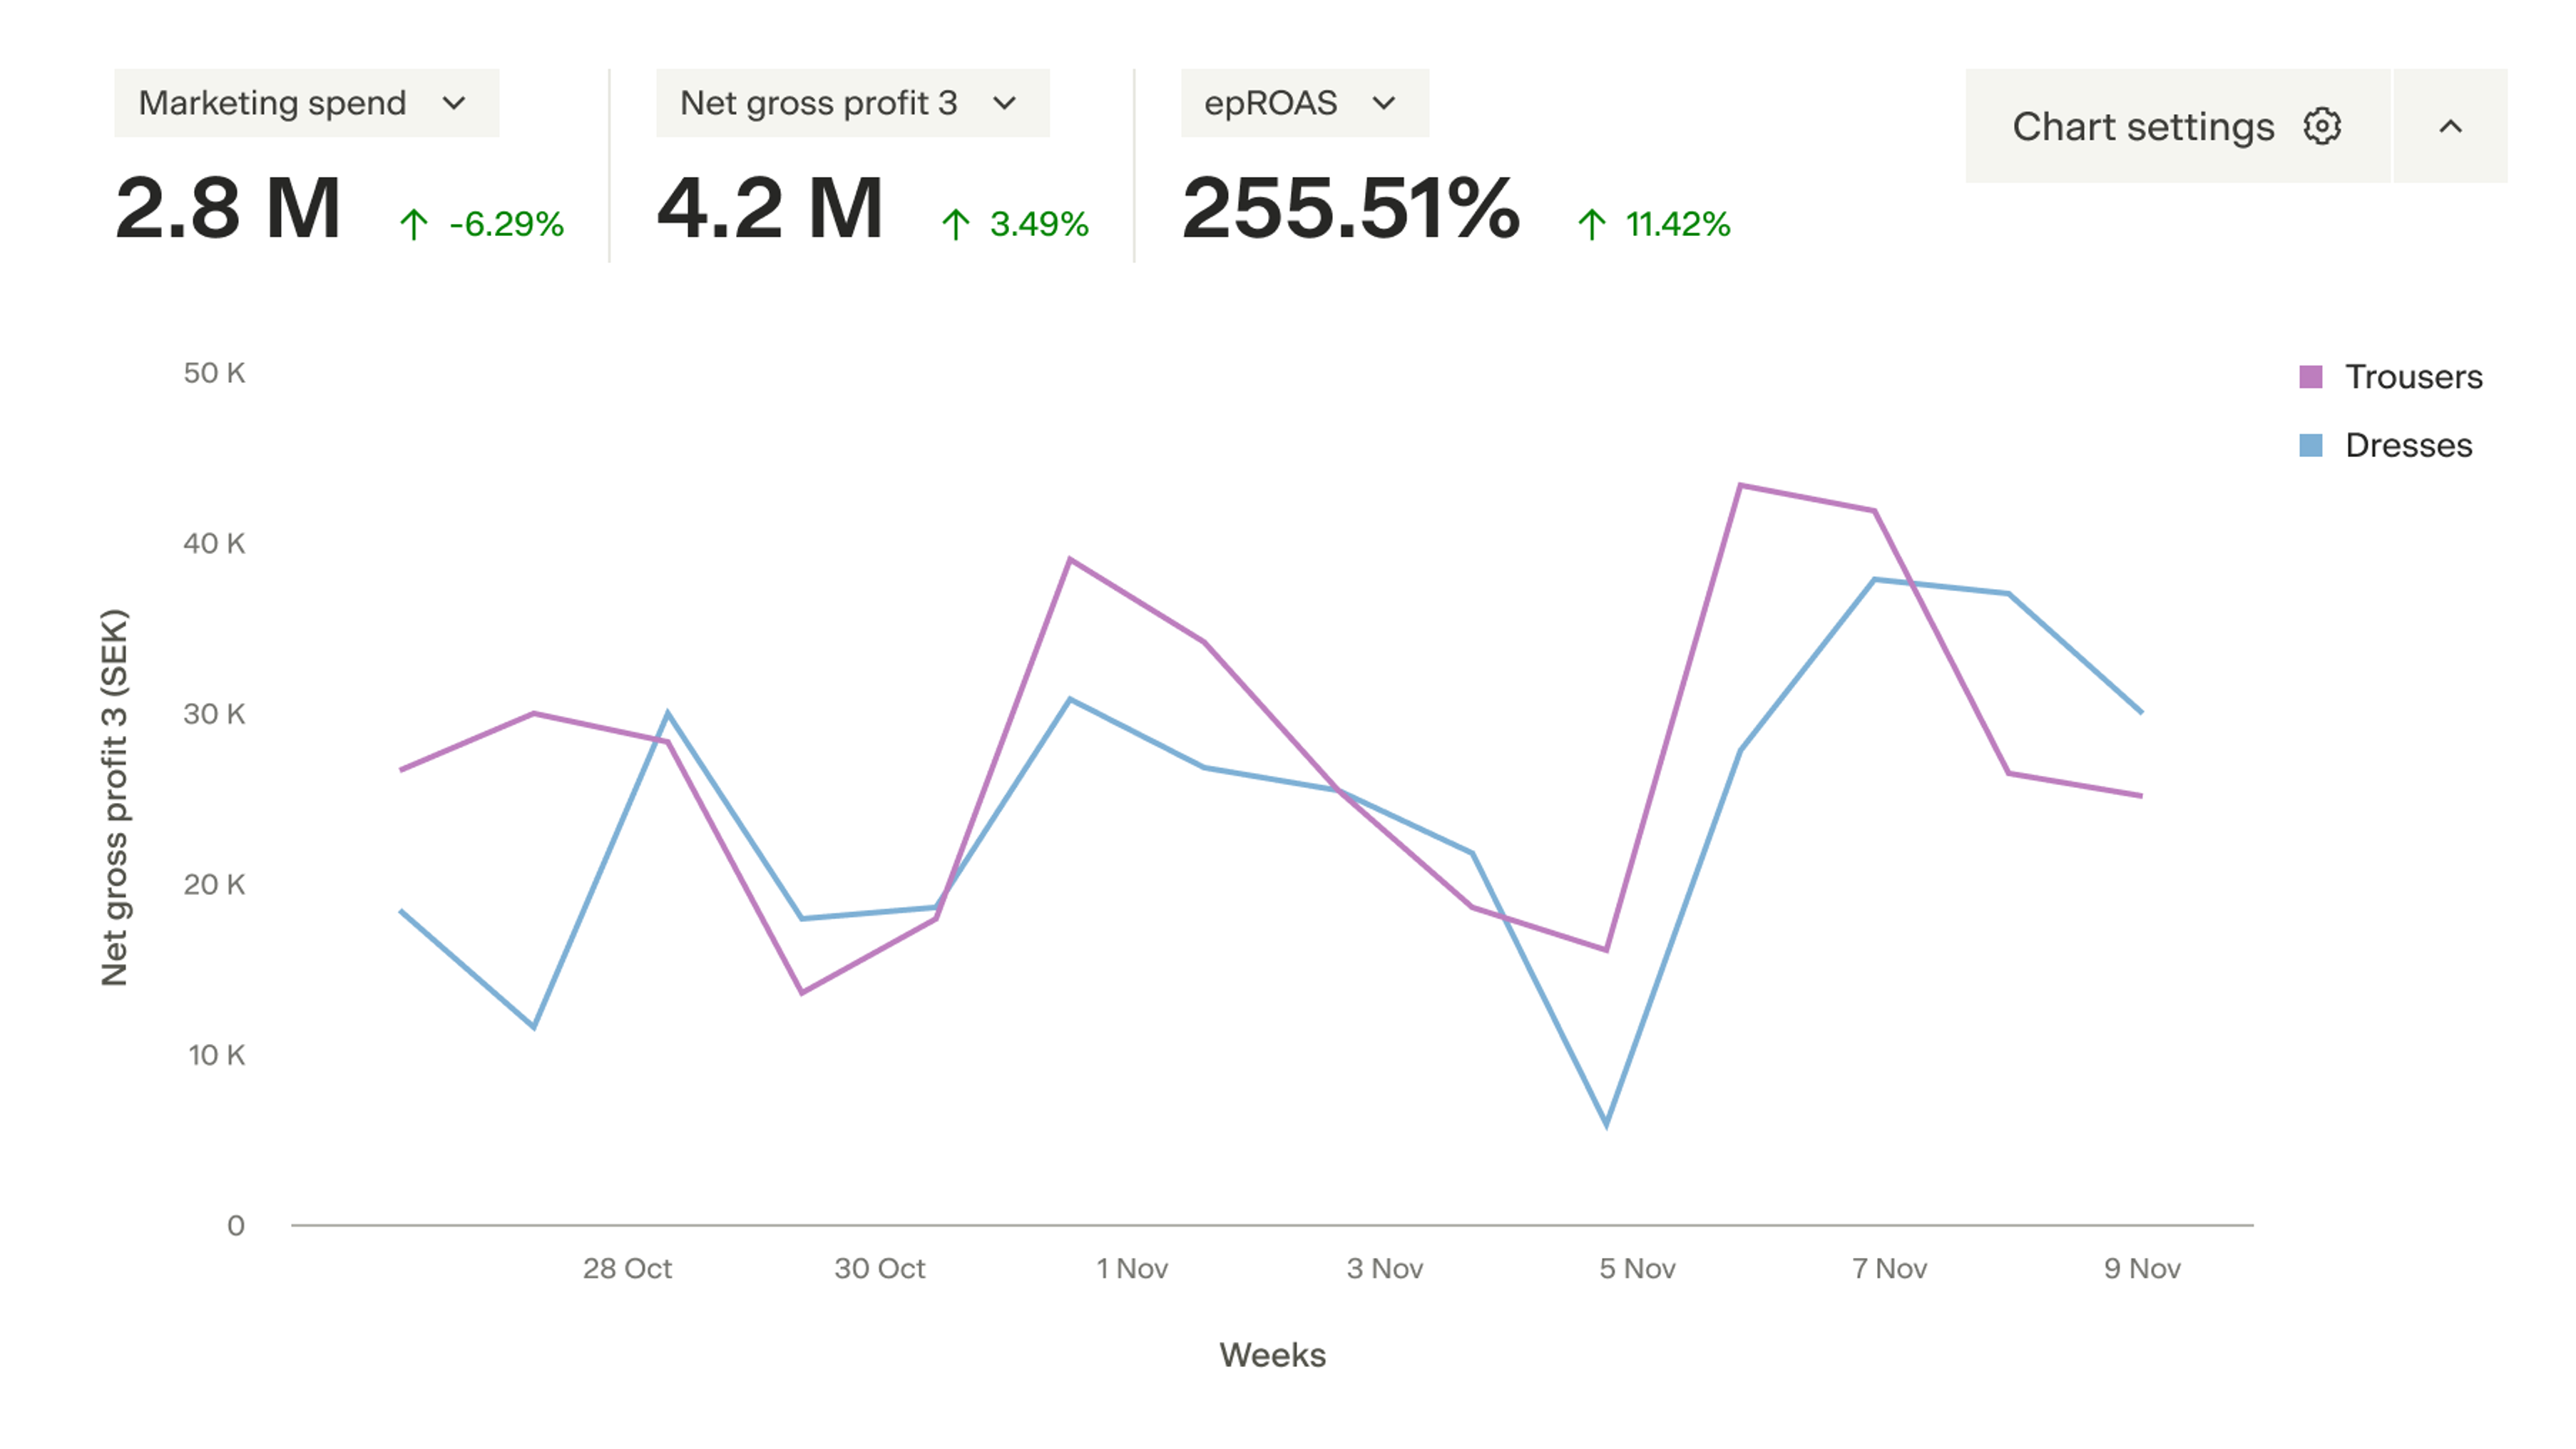
Optimize your product performance
Which products are diluting your profits? Which products are underserved and have the potential to increase your profits?
- Stop wasted ad spend on low-performing products
- Find slow movers before it’s too late
- Increase your most profitable assortment
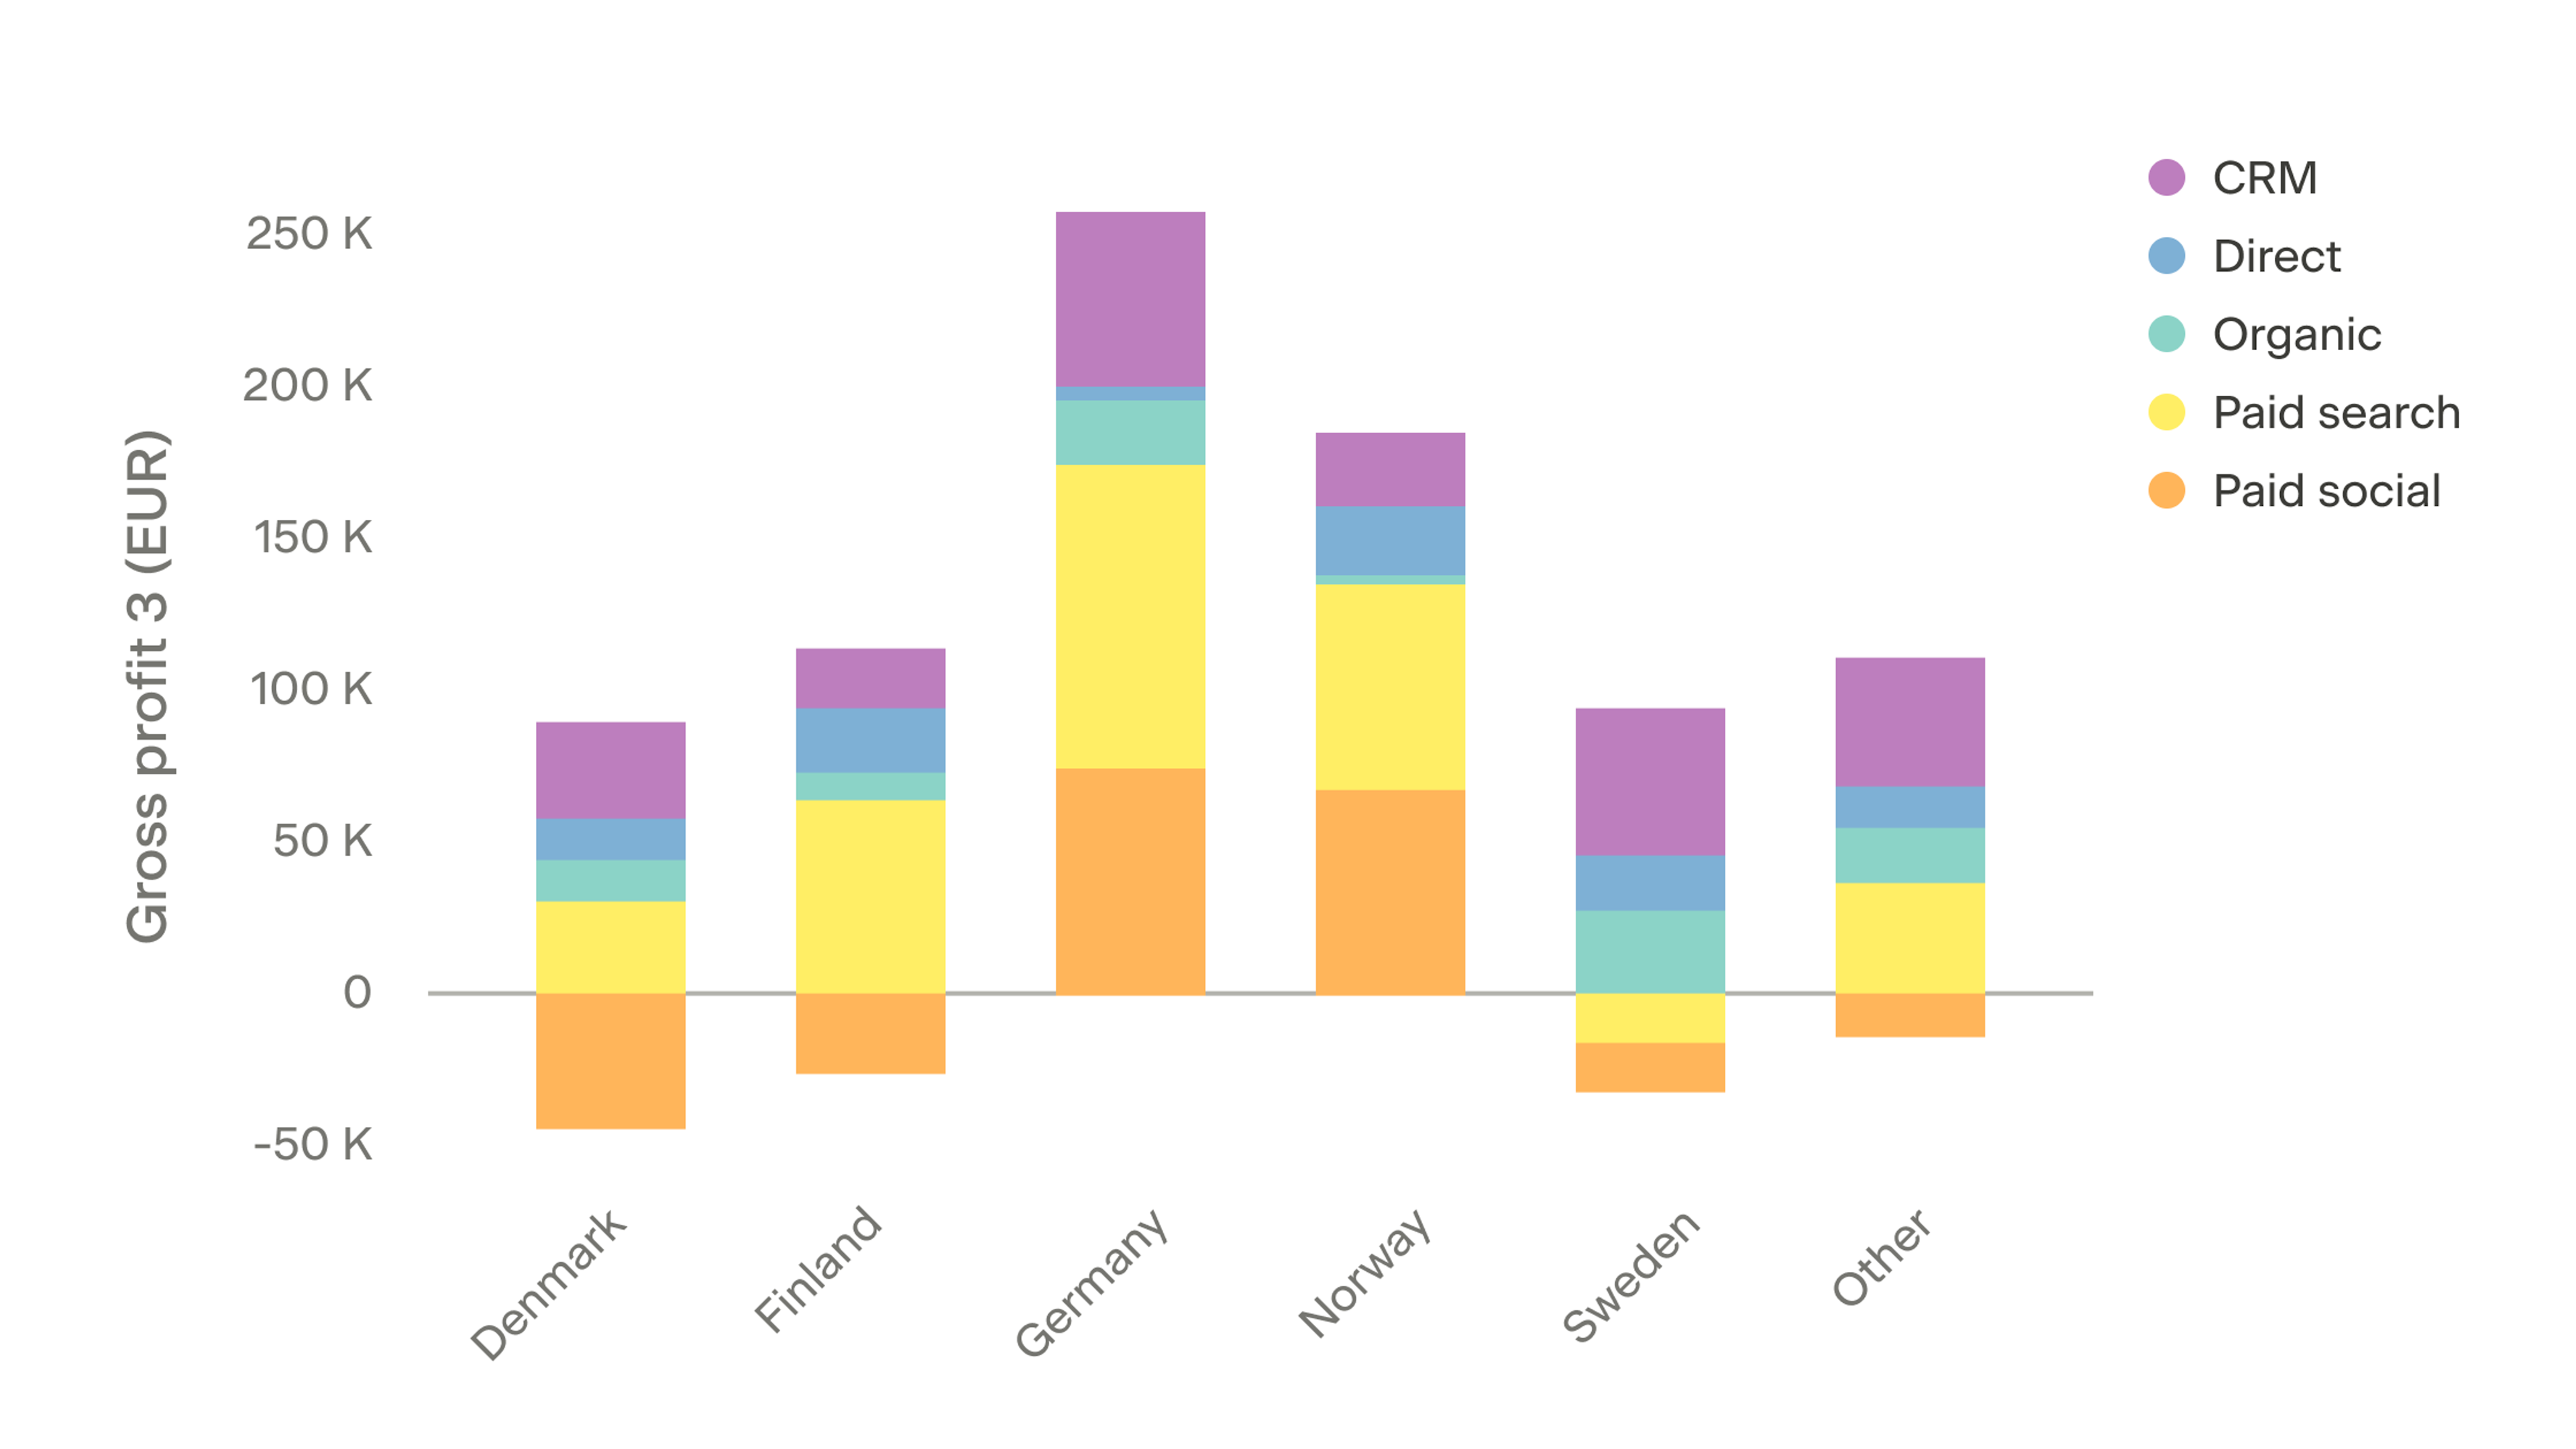
Optimize campaigns across different markets
Imagine getting insights in real-time into all your markets' performance; no more guessing where you make your profits.
- Understand which markets drive profits
- Optimize marketing in a granular way
- Find new opportunities based on your data
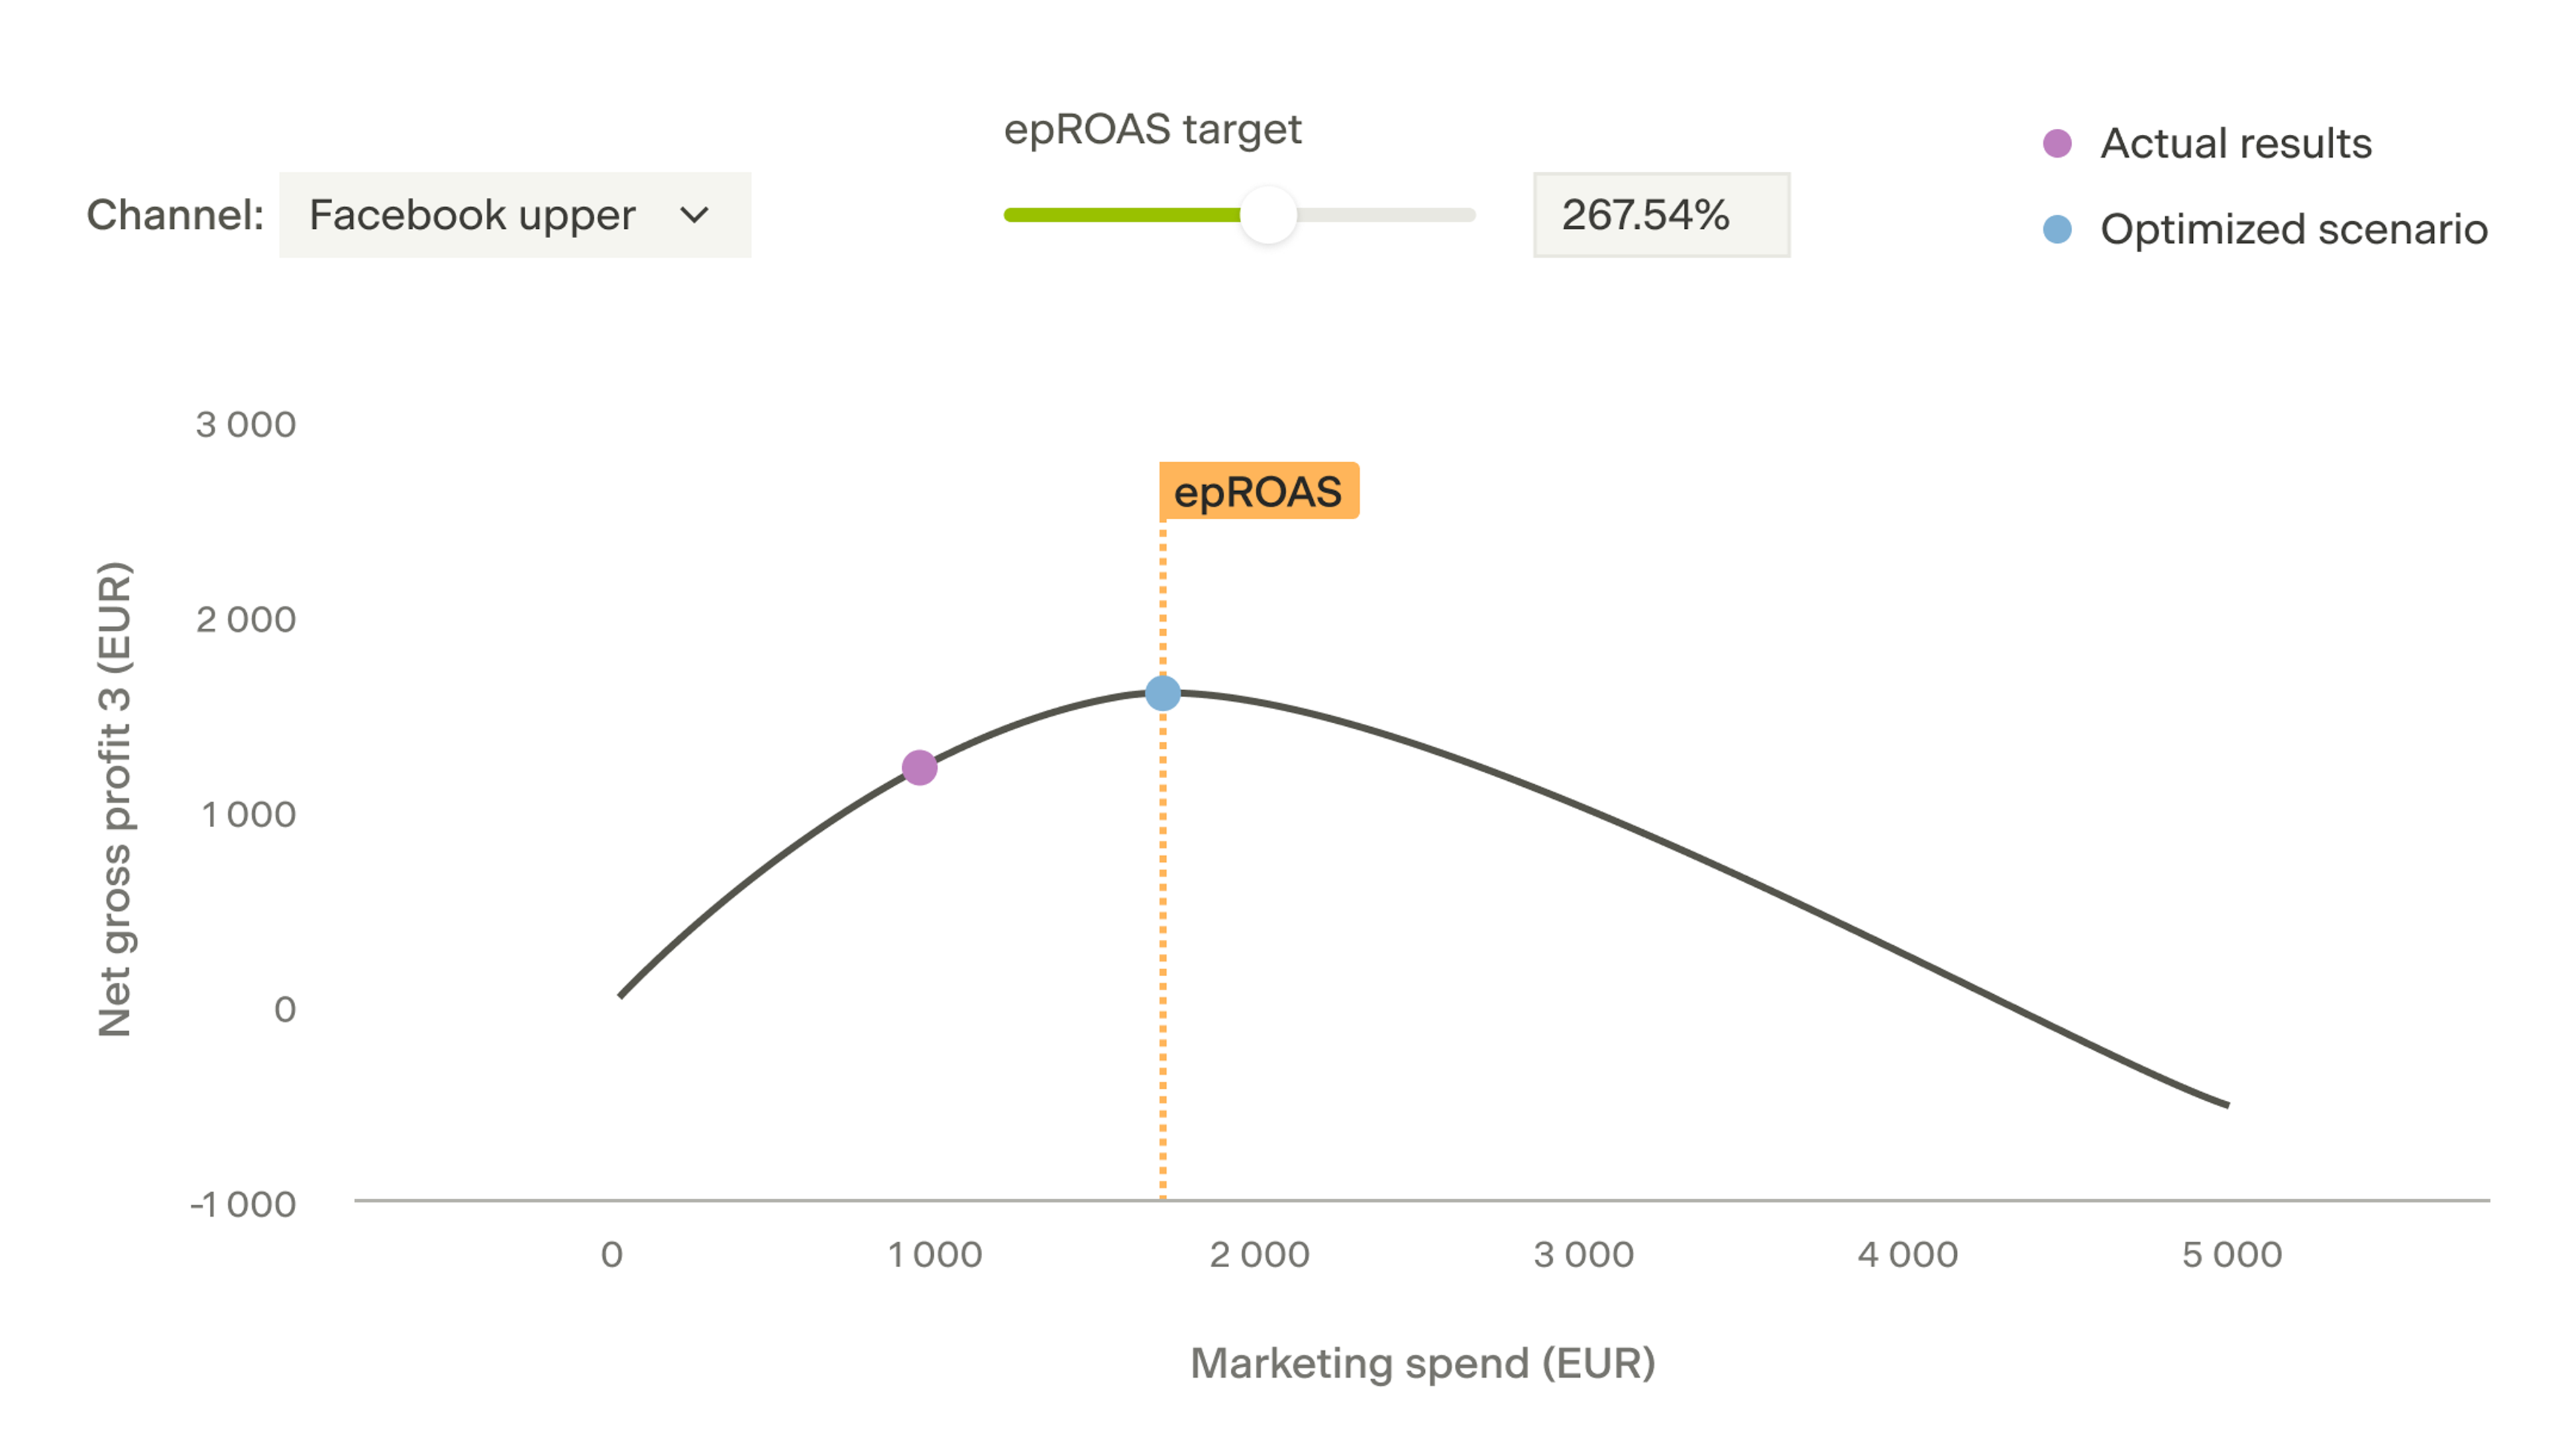
Prediction models at your service
Get real-time predictions on future sales, profit, and inventory on the product level. With a click, switch to Dema's dynamic marketing mix model, which helps you optimize marketing spend for profit, sell-through rate, and more.
- Save hours and millions on outdated processes for forecasting
- Buy the right amount of inventory at the right time
- Get in control of your profit, cash-flow, and steer your organization with ease.
FAQ
What can you expect?
Read more about how Ridestore, part of the top 1% of e-commerce companies, uses Dema and how their profitability increased even more.
Do you want to know more?
We are always happy to jump on a call to show more and get to know you better.